Most dashboards are built to be explored, not glanced at. They have twenty charts, a date picker and a filter bar, and they answer every question except the one you have when you look: is everything okay? A glanceable metric answers that question in under a second. Here is what makes a number glanceable, and how to shape yours so it earns a spot on your Home Screen.
1. It answers one question
A glanceable metric is a single number tied to a single question. "How is the business doing?" is not one question. "How many people signed up today?" is. If you cannot say the question a number answers in one short sentence, it belongs on a dashboard you open on purpose, not on a widget you see all day.
2. It changes on a timescale you can feel
Yearly revenue barely moves from one glance to the next, so you stop seeing it. Signups today, open support tickets or the time since your last backup change during the day, and that movement is what catches your eye. Pick numbers that move between the times you look at them.
3. It tells you whether to act
The best glanceable numbers carry their own verdict. Color does this better than anything: green means carry on, red means look now. Instead of computing colors in your script, you can describe the rule once and let it apply forever:
curl -X PUT https://api.widgetdash.app/api/v1/data/backups \
  -H "Authorization: Bearer YOUR_WRITE_KEY" \
  -H "Content-Type: application/json" \
  -d '{
    "display_name": "Backups",
    "icon": "externaldrive.fill",
    "metrics": [
      { "label": "Last backup", "value": "2026-11-04T05:00:00Z", "type": "timestamp" }
    ],
    "color_rules": {
      "Last backup": [ { "older_than": "24h", "color": "red" }, { "color": "green" } ]
    }
  }'
The widget shows "3 hours ago" and counts up on its own. When the last backup is more than a day old, it turns red at the widget's next refresh, even if your backup script has died and never pushes again. That last part matters: a metric that can only change when everything works will never warn you when something breaks.
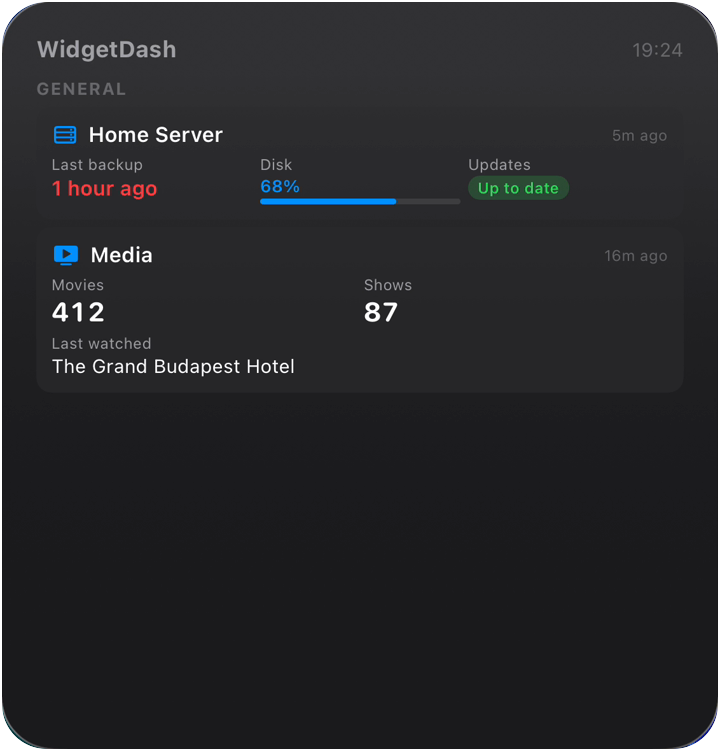
In the widget below the rule was set to one hour instead of a day, so it turned red at "1 hour ago" with nobody touching the phone.
4. It is honest
Vanity numbers, such as total signups since launch, only go up, so they feel good and tell you nothing. Pick the number you would be a little nervous to look at: churn this month, failed jobs, days of runway left. If a number never makes you change what you do, swap it for one that would.
5. It is short
A widget is small. "$8,469" reads at a glance; "$8,469.27 (up 0.58% from yesterday)" does not. Round values, use units people know, and drop decimals you would never act on. Values in WidgetDash are plain strings, so format them in your script exactly as you want them read: "$8.5k", "99.98%", "+38".
Why most dashboards fail at this
Dashboards fail at glancing for structural reasons, not design ones:
- They live behind a login. Anything you have to open, you open less often than you should.
- They show everything. When twenty numbers have equal weight, none of them stands out.
- They are neutral. A chart shows a line; it does not tell you the line is bad.
A Home Screen or Lock Screen widget fixes the first problem by default. The rest is up to the numbers you choose. Pick three to five that pass the rules above, and leave the rest on the dashboard. If you are not sure where each one should go, Home Screen vs Lock Screen widgets covers that, and How to put your SaaS metrics on your iPhone Home Screen walks through the setup.
A quick checklist
- Can you say the question it answers in one sentence?
- Does it change between the times you look?
- Does its color tell you whether to act?
- Would a bad value make you do something today?
- Is it short enough to read in a second?
A number that passes all five belongs on your Home Screen.
FAQ
How many numbers should a widget show?
Three to five. A Large WidgetDash widget can hold more, but past five you are back to reading a dashboard.
Do colors work without pushing a color every time?
Yes. Send color_rules once and the server keeps them. Rules can use above, below, equals, and for timestamps older_than and newer_than.
What if my data is not a number?
Text and status values work too, such as "Up to date" or "Deploying". A status with a color rule is often the most glanceable value of all.